
More Information
Submitted: December 05, 2025 | Accepted: December 17, 2025 | Published: December 18, 2025
Citation: Laiseca JDL. Anthropometric Profile, Biological Maturation, and Nutritional Status in Schoolchildren from Neiva, Huila, Colombia: A Cross-Sectional Analysis of Maturity Offset and the Double Burden of Malnutrition. J Adv Pediatr Child Health. 2025; 8(2): 033-038. Available from:
https://dx.doi.org/10.29328/journal.japch.1001078
DOI: 10.29328/journal.japch.1001078
Copyright License: © 2025 Laiseca JDL. This is an open access article distributed under the Creative Commons Attribution License, which permits unrestricted use, distribution, and reproduction in any medium, provided the original work is properly cited.
Keywords: Biological maturation; Peak height velocity; Anthropometry; Double burden of malnutrition; Maturity offset; Adolescents

Anthropometric Profile, Biological Maturation, and Nutritional Status in Schoolchildren from Neiva, Huila, Colombia: A Cross-Sectional Analysis of Maturity Offset and the Double Burden of Malnutrition
Jose David Lopez Laiseca*
Calle 11 b # 29 a bis 18, Neiva- Huila, Colombia
*Corresponding author: Jose David Lopez Laiseca, Calle 11 b # 29 a bis 18 Neiva- Huila, Colombia, Email: [email protected]
This cross-sectional study aimed to characterize anthropometric indicators, biological maturation status, and nutritional patterns in schoolchildren from Neiva, Huila, Colombia. A total of 193 participants (108 males and 85 females) were evaluated. Biological maturation was estimated using the Maturity Offset (MO) method, and Age at Peak Height Velocity (APHV) was calculated using the Moore model based on chronological age and stature.
Mean APHV was 14.18 ± 0.69 years in males and 12.52 ± 0.41 years in females, indicating that males were, on average, in the Circa-PHV stage, whereas females had progressed to the Post-PHV stage. A Double Burden of Malnutrition was identified, characterized by the coexistence of underweight and overweight/obesity within the same population. Correlation analysis revealed weak associations between MO and adiposity indicators, particularly body mass index (p ≤ 0.357), suggesting a decoupling between skeletal maturation and fat mass accumulation.
These findings indicate that biological maturation follows a trajectory largely independent of adiposity and underscore the importance of incorporating biological age into nutritional assessment and exercise prescription. Given the historical nature of the dataset (2013), updated longitudinal studies are required to monitor secular trends in growth, maturation, and nutritional status in this region.
Adolescence constitutes a critical stage of human development characterized by profound physical, cognitive, and social changes, among which the interindividual variability in the timing of Peak Height Velocity (PHV) stands out [1-3]. In this context, the estimation of biological maturation status using the maturity offset (MO) has been established as a fundamental tool for understanding growth tempo and guiding the individualization of health and sport-related interventions [4].
However, the application of maturation prediction equations presents important methodological challenges. Models based on multiple anthropometric measurements may generate bias when applied to populations with body proportions that differ from those of the original reference samples [5,6]. In this context, the simplified model proposed by Moore, et al. [7], which relies exclusively on chronological age and height, has been adopted as a pragmatic alternative for estimating age at PHV (APHV) in populations without local validation. This approach has recently been applied in studies conducted in the department of Huila to construct regional anthropometric reference values [8,9]. At the national level, a systematic review highlighted significant gaps in research on growth and biological maturation in Colombian children and adolescents, reinforcing the relevance of regional population-based studies [10].
From an epidemiological perspective, the school population in Neiva faces the double burden of malnutrition (DBM), characterized by the coexistence of underweight and excess adiposity [11,12]. This phenomenon, also documented by the National Survey of Nutritional Status (ENSIN 2015) [13], is closely linked to growth and maturation processes. Early biological maturation has been associated with increased metabolic and cardiovascular risk, whereas late maturation may prolong critical periods for linear growth recovery [14-16]. Consequently, understanding MO and its relationship with body composition is essential for monitoring developmental trajectories and for planning pediatric health and sports programs based on individual biological risk profiles [17-19].
Within this framework, the objectives of the present study were: (i) to describe the anthropometric profile of schoolchildren from Neiva, Huila, Colombia; (ii) to estimate biological maturation status by calculating MO and APHV using the Moore et al. model [7]; and (iii) to analyze, separately for males and females, the relationship between estimated biological maturation and anthropometric indicators.
Participants and ethical considerations
The study sample comprised 193 schoolchildren (108 males and 85 females) enrolled in public educational institutions in the city of Neiva, Huila. Chronological age was calculated using August 9, 2013, as the reference date. The study was conducted in accordance with the ethical principles established in the Declaration of Helsinki [20] and complied with Colombian regulations governing research involving minors, particularly Resolution 008430 of 1993 [21]. Informed consent was obtained from parents or guardians, and assent was obtained from all participants. Participant confidentiality and welfare were ensured throughout the research process.
Anthropometric protocol
Anthropometric measurements, including standing height, body weight, sitting height, arm span, waist circumference, and hip circumference, were obtained by trained evaluators following the standardized procedures of the International Society for the Advancement of Kinanthropometry (ISAK) [22].
Standing height was measured barefoot using a Siber-Hegner Machines SA GPM anthropometer. Body weight was assessed with a Seca model 761 scale, with a precision of 0.5 kg, and participants wore light clothing. Body mass index (BMI) was calculated using the formula weight (kg) / height (m²) [23,24].
Nutritional classification (methodological warning)
The nutritional status classification presented in Table 2 is based on absolute BMI thresholds and was used exclusively as a preliminary descriptive approach to illustrate the presence of the double burden of malnutrition. It is acknowledged that the clinical classification recommended by the World Health Organization (WHO) [25] and by Colombian Resolution 2465 of 2016 [26] must be performed using BMI-for-age Z-scores (BMI/A), adjusted for sex and chronological age.
Estimation of biological maturation
Biological maturation status was estimated using the maturity offset (MO) method based on the two-variable equation proposed by Moore, et al. [7], selected for its applicability in cross-sectional designs and its relative stability for population-level estimates. In the equations, height is expressed in centimeters (cm):
- Males: MO (years) = −7.999994 + 0.0036124 × (age × height)
- Females: MO (years) = −7.709133 + 0.0042232 × (age × height)
Negative MO values indicate years before PHV, whereas positive values indicate years after PHV.
Statistical analysis
Associations between maturity offset and anthropometric variables were examined using Spearman’s rank correlation coefficient (ρ), with analyses conducted separately for males and females. Statistical significance was set at p < 0.05. All statistical procedures were performed using the trial version of MATLAB software (R2023b). Before analysis, data were screened for outliers and verified for the absence of missing values.
Biological maturation profile (MO and APHV)
Table 1 presents the mean values of Maturity Offset (MO) and Age at Peak Height Velocity (APHV) stratified by sex. On average, male participants were positioned in the Circa-PHV phase (MO = −0.67 ± 1.25 years), whereas females had already passed PHV, as reflected by a positive MO value (0.82 ± 0.95 years).
| Table 1: Biological maturation profile (MO and APHV) estimated using the Moore, et al. model [7]. | ||||
| Sex | Mean MO (years) | SD MO | Mean APHV (years) | SD APHV |
| F | 0.82 | 0.95 | 12.54 | 0.41 |
| M | −0.67 | 1.25 | 14.18 | 0.69 |
The estimated APHV values were 14.18 ± 0.69 years for males and 12.54 ± 0.41 years for females. These estimates are consistent with previous reports for schoolchildren from the Huila region and with international growth references, supporting the biological plausibility of the maturation estimates [8,27].
Figure 1 illustrates a conceptual growth velocity curve (GVC) depicting the average maturational position of the cohort. The diagram indicates that males are approaching their maximum linear growth rate (Circa-PHV), whereas females are predominantly in the post-peak deceleration phase (Post-PHV), a pattern consistent with established maturational trajectories [2,8].
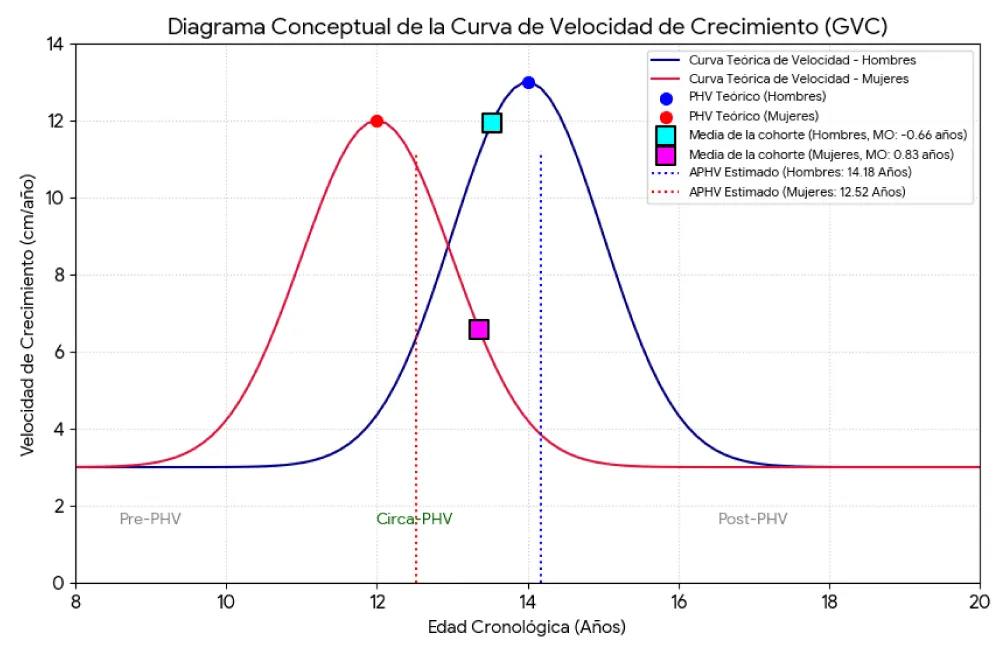
Figure 1: Conceptual diagram of the growth velocity curve (GVC).
Nutritional status (simplified BMI classification)
Table 2 summarizes the distribution of nutritional status using simplified BMI thresholds. The results demonstrate the presence of a pronounced Double Burden of Malnutrition (DBM), characterized by the coexistence of underweight and overweight/obesity within the same population. Underweight prevalence was higher among males (34.5%) compared with females (30.3%). Conversely, overweight/obesity was slightly more prevalent among females (6.7%) than males (5.5%).
| Table 2: Percentage distribution of nutritional status (simplified BMI classification). | ||||
| Sex | Underweight (%) | Risk (%) | Normal (%) | Overweight/Obesity (%) |
| F | 30.3 | 13.5 | 49.4 | 6.7 |
| M | 34.5 | 28.2 | 31.8 | 5.5 |
| Note: These values represent an approximate descriptive classification and do not constitute a clinical nutritional diagnosis based on BMI-for-age Z-scores. | ||||
Correlational analysis: Biological maturation and anthropometry
Table 3 presents the Spearman correlation coefficients (p) between Maturity Offset (MO) and six anthropometric variables, analyzed separately by sex. Standing height showed the strongest association with MO in both males (p = 0.856) and females (p = 0.746), followed by body mass and hip circumference.
| Table 3: Spearman’s correlation (ρ) between maturity offset and anthropometric variables. | ||
| Variable | Males (ρ) | Females (ρ) |
| Height (cm) | 0.856 | 0.746 |
| Weight (kg) | 0.605 | 0.622 |
| BMI (kg/m²) | 0.260 | 0.357 |
| Arm span (cm) | 0.522 | 0.605 |
| Waist circumference (cm) | 0.426 | 0.402 |
| Hip circumference (cm) | 0.625 | 0.477 |
In contrast, adiposity-related indicators—BMI and waist circumference—exhibited weak associations with MO (p ≤ 0.357 for BMI and p ≤ 0.426 for waist circumference). This pattern suggests a limited relationship between the timing of skeletal maturation and indicators of fat accumulation. All reported correlations were statistically significant (p < 0.05).
Growth and maturation pattern: Plausibility and local context
The estimated APHV values observed in this study (14.18 years in males and 12.54 years in females) fall within the ranges consistently reported in the international literature on pubertal development and growth dynamics [2,17,28]. These estimates are also concordant with recent regional evidence from the department of Huila, reinforcing their contextual validity [8,9]. Collectively, this agreement supports the biological plausibility of the maturity offset model proposed by Moore et al. [7], applied here as a pragmatic solution in the absence of locally validated maturation equations, as recommended in population-based research [29,30].
From an auxological and physical anthropology perspective, these findings align with well-established principles describing sex-specific growth trajectories during adolescence [31,32]. The predominance of a Circa-PHV maturational stage among males and a Post-PHV stage among females is consistent with expected developmental patterns at this school age.
Correlational analysis further demonstrated that standing height was the anthropometric variable most strongly associated with maturity offset, particularly in males (p = 0.856). This observation is coherent with previous evidence indicating that linear growth is the primary driver of maturational progression during the rapid growth acceleration phase [33,34]. In females, the slightly weaker association (p = 0.746) likely reflects post-PHV biological processes, including shifts in body composition and patterns of fat mass redistribution [35-37].
Decoupling between skeletal maturation and adiposity: A key biological finding
One of the most relevant findings of this study is the weak association between skeletal maturation and adiposity-related indicators. While maturity offset showed a very strong relationship with height, its correlations with BMI (p ≤ 0.357) and waist circumference (p ≤ 0.426) were notably low.
This decoupling phenomenon has been previously documented in pediatric and adolescent populations, suggesting that biological maturation follows a trajectory largely independent of fat mass accumulation [36,38,39]. The moderate association observed with hip circumference (p ≤ 0.625) reinforces its relevance as an anthropometric marker linked to cardiometabolic risk during childhood and adolescence [40-42].
Furthermore, the limited performance of BMI compared with central adiposity indicators supports accumulating evidence that waist circumference may offer greater sensitivity for identifying cardiovascular and metabolic risk in youth [43]. Taken together, these findings indicate that, in this cohort, skeletal maturation progresses primarily in accordance with linear growth velocity [33,44], whereas adiposity appears to be regulated by partially independent biological and environmental mechanisms [45,46].
Nutritional status and the double burden of malnutrition
The coexistence of high underweight prevalence (30% - 34%) with moderate levels of overweight/obesity (5% - 7%) confirms the presence of the Double Burden of Malnutrition (DBM) in this population [11]. Although the nutritional classification applied in this study was based on simplified BMI thresholds rather than WHO BMI-for-age Z-scores, the observed pattern mirrors national and regional reports documenting this epidemiological transition [13,47].
In this context, nutritional surveillance and clinical assessment should prioritize the use of locally derived growth percentiles for the Huila population, which provide a more sensitive and culturally appropriate framework for evaluating child and adolescent growth [48]. This recommendation is consistent with international guidelines emphasizing contextualized growth assessment [15,16].
Implications for public health and sports science
Public health: The identification of DBM highlights the urgent need for integrated public health strategies that simultaneously address nutritional deficits and excess adiposity. Dual-focus interventions are essential to mitigate long-term cardiometabolic risk while supporting optimal growth and development [11]. The incorporation of regional growth references may further enhance diagnostic accuracy and improve population-level risk stratification.
Sports science: Biological maturation status represents a critical variable for exercise prescription and talent development in youth. The distinction between Circa-PHV and Post-PHV stages is particularly relevant, as biological age strongly influences training responsiveness and injury susceptibility [4,49,50].
- Circa-PHV males: Training programs should prioritize technical skill development and moderated mechanical loading due to transient increases in injury risk.
- Post-PHV females: This stage represents an optimal window for the implementation of higher-intensity strength training aimed at maximizing bone mineral density and lean mass accrual [51,52].
Limitations and future perspectives
This study is limited by its cross-sectional design and the use of historical data collected in 2013. Given the presence of positive secular trends in growth, maturation timing, and overweight, the findings should be interpreted strictly as representative of the studied cohort and should not be extrapolated as current reference values.
Methodologically, reliance on maturation equations developed in external populations underscores the need for local validation and calibration of maturity offset models for children and adolescents from Huila [10]. Future research should:
- Conduct local cross-validation studies of maturation prediction equations [18,53,54];
- Adjust models according to regional anthropometric proportions and growth patterns [15,53,54];
- Incorporate advanced longitudinal modeling approaches, such as SITAR, to improve individual-level estimation of peak height velocity [55].
This cross-sectional study characterized the biological maturation status and anthropometric profile of schoolchildren from Neiva, Huila, Colombia. The findings indicate that, on average, males were positioned in the Circa-PHV stage, whereas females had already transitioned to the Post-PHV stage, according to the maturity offset model proposed by Moore, et al. [7]. In addition, the results revealed the presence of a double burden of malnutrition, characterized by the coexistence of underweight and overweight/obesity. It should be noted, however, that this nutritional classification represents an approximate descriptive approach based on BMI values not adjusted for age and sex.
The principal finding of this study was the weak association observed between skeletal maturation and adiposity-related indicators. While biological maturation was strongly associated with linear growth, its relationship with BMI and waist circumference was limited, suggesting that cardiometabolic risk is not directly determined by the biological timing of peak linear growth. This dissociation underscores the importance of designing nutritional, public health, and sports interventions that simultaneously consider biological age and body composition, without assuming a parallel or synchronous progression between these processes.
Given that the analyzed data correspond to measurements collected in 2013, the results should be interpreted as a point-in-time characterization of the studied cohort rather than as contemporary reference values. Future longitudinal studies or updated population-based surveys are therefore necessary to assess secular trends in growth, maturation, and nutritional status in this region. Finally, the findings emphasize the need to validate population-specific biological maturation equations for children and adolescents from Neiva and to prioritize the clinical use of standardized indicators, such as BMI-for-age Z-scores, in accordance with current national and international guidelines.
- Baxter-Jones ADG, Sherar LB. Growth and maturation. In: Armstrong N, editor. Paediatric exercise physiology. London: Elsevier. 2006;1–30.
- Malina RM, Rogol AD, Cumming SP, Coelho e Silva MJ, Figueiredo AJ. Biological maturation of youth athletes: assessment and implications. Br J Sports Med. 2015;49(13):852–9. Available from: https://doi.org/10.1136/bjsports-2015-094623
- Baxter-Jones ADG, Barbour-Tuck EN, Dale D, Sherar LB, Knight CJ, Cumming SP, et al. The role of growth and maturation during adolescence on team-selection and short-term sports participation. Ann Hum Biol. 2020;47(4):316–23. Available from: https://doi.org/10.1080/03014460.2019.1707870
- Lloyd RS, Oliver JL, Faigenbaum AD, Myer GD, De Ste Croix MBA. Chronological age vs biological maturation: implications for exercise programming in youth. J Strength Cond Res. 2014;28(5):1454–64. Available from: https://doi.org/10.1519/jsc.0000000000000391
- Gómez-Campos R, Hespanhol JE, Portella D, Vargas Vitoria R, De Arruda M, Cossio-Bolaños MA. Predicting somatic maturation from anthropometric variables: validation and proposed equations to school in Brazil. Nutr Clin Diet Hosp. 2012;32(3):7–17. Available from: https://revista.nutricion.org/PDF/PREDICCION.pdf
- Fransen J, Bush S, Woodcock S, Novak A, Deprez D, Baxter-Jones ADG, et al. Improving the prediction of maturity using a maturity ratio. Pediatr Exerc Sci. 2018;30(2):296–307. Available from: https://doi.org/10.1123/pes.2017-0009
- Moore SA, McKay HA, Macdonald H, Nettlefold L, Baxter-Jones ADG, Mirwald RL, et al. Enhancing a somatic maturity prediction model. Med Sci Sports Exerc. 2015;47(8):1756–64. Available from: https://doi.org/10.1249/mss.0000000000000588
- López-Laiseca JD, Massuça LM. Age of pubertal height growth spurt in children and adolescents from Huila, Colombia. Rev Fac Med. 2023;71:e102130. Available from: https://doi.org/10.15446/revfacmed.v71n4.102130
- Laiseca JDL, Norton KI, Massuça LM. Body size of children and adolescents from sports schools in Neiva-Huila, Colombia. Sports. 2025;13(11):371. Available from: https://doi.org/10.3390/sports13110371
- López-Laiseca JD, Massuça LM. Reference values for height, weight, and body mass index in Colombian children and adolescents. Rev Fac Med. 2021;69(3):e300.
- Cediel-Giraldo G, Castaño-Moreno E, Gaitán-Charry D. Doble carga de malnutrición durante el crecimiento en Colombia. Rev Salud Publica (Bogota). 2016;18(4):527–39.
- Mazariegos M, Sánchez BN, Ortigoza A, Moore K, Kroker-Lobos MF, Ramírez-Zea M, et al. Double burden of malnutrition in 115 Latin American cities: ecological analysis. Rev Fac Cienc Salud. 2024;2(103). Available from: https://doi.org/10.1002/rfc2.103
- Instituto Colombiano de Bienestar Familiar. Encuesta Nacional de Situación Nutricional en Colombia (ENSIN 2015). Bogotá: ICBF; 2017.
- Jung C, Fischer N, Fritzenwanger M, Pernow J, Brehm BR, Figulla HR. Association of waist circumference and cardiovascular risk factors in adolescents. Pediatr Diabetes. 2009;10(5):329–35. Available from: https://doi.org/10.1111/j.1399-5448.2008.00486.x
- Organización Mundial de la Salud. Crecimiento y desarrollo del niño y del adolescente. Ginebra: OMS; 1993. Available from: https://www.who.int/es/health-topics/adolescent-health#tab=tab_1
- Balasundaram P, Avulakunta ID. Human growth and development. In: StatPearls [Internet]. Treasure Island (FL): StatPearls Publishing; 2023. Available from: https://www.ncbi.nlm.nih.gov/books/NBK567767/
- Beunen GP, Malina RM. Growth and biologic maturation: relevance to athletic performance. In: Hebestreit H, Bar-Or O, editors. The young athlete. Oxford: Blackwell Publishing; 2008. p. 3–17. Available from: https://doi.org/10.1002/9780470696255.ch1
- Malina RM, Bouchard C, Bar-Or O. Growth, maturation, and physical activity. 2nd ed. Champaign (IL): Human Kinetics; 2004. Available from: https://doi.org/10.5040/9781492596837
- Eisenmann JC, Till K, Baker J. Growth, maturation, and youth sports: issues and practical solutions. Ann Hum Biol. 2020;47(4):324–7. Available from: https://doi.org/10.1080/03014460.2020.1764099
- World Medical Association. Declaration of Helsinki: ethical principles for medical research involving human subjects. JAMA. 2013;310(20):2191–4. Available from: https://doi.org/10.1001/jama.2013.281053
- Ministerio de Salud. Resolución 008430 de 1993: normas éticas para la investigación en salud. Bogotá: Ministerio de Salud; 1993. Available from: https://tinyurl.com/ydm34yuv
- Stewart A, Marfell-Jones M, Olds T, De Ridder J. International standards for anthropometric assessment. Lower Hutt: ISAK; 2011. Available from: https://www.researchgate.net/publication/236891109_International_Standards_for_Anthropometric_Assessment
- Lohman TG, Roche AF, Martorell R. Anthropometric standardization reference manual. Champaign (IL): Human Kinetics; 1988. Available from: https://www.ngds-ku.org/Papers/J78/Lohmann.pdf
- Kobel S, Kirsten J, Kelso A. Anthropometry – assessment of body composition. Dtsch Z Sportmed. 2022;73:106–11. Available from: https://www.germanjournalsportsmedicine.com/archive/archive-2022/issue-3/anthropometry-assessment-of-body-composition/
- World Health Organization. WHO Child Growth Standards. Geneva: World Health Organization; 2006.
- Ministerio de Salud y Protección Social. Resolución 2465 de 2016: indicadores antropométricos para Colombia. Bogotá: Ministerio de Salud y Protección Social; 2016.
- Areekal SA, Goel P, Khadilkar A, Khadilkar V, Cole TJ. Assessment of height growth in Indian children using growth centiles. Ann Hum Biol. 2022;49(5–6):228–35. Available from: https://doi.org/10.1080/03014460.2022.2107238
- Tsutsui T, Iizuka S, Sakamaki W, Maemichi T, Torii S. Growth until peak height velocity occurs rapidly in early maturing adolescent boys. Children. 2022;9(10):1570. Available from: https://doi.org/10.3390/children9101570
- Müller L, Müller E, Hildebrandt C, Kapelari K, Raschner C. Assessment of biological maturation for talent selection. Sportverletz Sportschaden. 2015;29(1):56–63. Available from: https://doi.org/10.1055/s-0034-1399043
- Charbonnet B, Sieghartsleitner R, Schmid J, Zuber C, Zibung M, Conzelmann A. Maturity-based correction mechanism for talent identification. J Sports Sci Med. 2022;21:640–57. Available from: https://doi.org/10.52082/jssm.2022.639
- Carter JEL, Heath BH. Somatotyping: development and applications. Cambridge: Cambridge University Press; 1990. Available from: http://catdir.loc.gov/catdir/samples/cam034/89035775.pdf
- Hernández Vásquez LA. Determinación del perfil antropométrico y físico en escolares de 10–16 años. Educ Ciudad. 2022;43:237–59.
- Rogol AD, Clark PA, Roemmich JN. Growth and pubertal development: effects of diet and physical activity. Am J Clin Nutr. 2000;72(2 Suppl):521S–8S. Available from: https://doi.org/10.1093/ajcn/72.2.521s
- Naddeh D, AlSharei ASAG. Nutrition and puberty. World Fam Med. 2022;20(1):152–165. Available from: https://doi.org/10.5742/MEWFM.2022.95221
- Martínez F, Silva J, Lagos F, Saguez R. Relación entre maturity offset, somatotipo y composición corporal en futbolistas. Retos. 2023;50:124–31.
- Curilem Gatica C, Sanzana DT, Curilem NT, Curilem ET. Relación entre maduración biológica y composición corporal en adolescentes. Rev Chil Nutr. 2019;46(6):701–7.
- Kang E, Chun D, Kang J, Kim J, Rhie YJ. Biological maturity and body composition changes in Korean adolescents. Endocr Abstr. 2025;110:P916. Available from: https://www.endocrine-abstracts.org/ea/0110/ea0110p916
- Bouchard C, Malina RM, Pérusse L. Genetics of fitness and physical performance. Champaign (IL): Human Kinetics; 1997. Available from: https://www.scirp.org/reference/referencespapers?referenceid=2109477
- Kim DS, Wheeler MT, Ashley EA. The genetics of human performance. Nat Rev Genet. 2022;23:40–54. Available from: https://doi.org/10.1038/s41576-021-00400-5
- Fernández JR, Redden DT, Pietrobelli A, Allison DB. Waist circumference percentiles by ethnicity in youth. J Pediatr. 2004;145(4):439–44. Available from: https://doi.org/10.1016/j.jpeds.2004.06.044
- Fernández JR, Redden DT, Pietrobelli A, Allison DB. Waist-to-hip ratio vs BMI in predicting risk factors. Int J Obes. 2000;24(11):1453–8.
- Trandafir LM, Russu G, Moscalu M, Miron I, Lupu VV, Leon Constantin MM, et al. Waist circumference as a clinical criterion for prediction of cardiovascular complications in children and adolescents with overweight and obesity. Medicine (Baltimore). 2020;99(30):e20923. Available from: https://doi.org/10.1097/md.0000000000020923
- Nevill AM, Bryant E, Wilkinson K, Gomes TN, Chaves R, Pereira S, et al. Waist circumference as a third dimension to BMI. Pediatr Obes. 2019;14(4):e12491. Available from: https://doi.org/10.1111/ijpo.12491
- Shu W, Li M, Vermund SH, Li H, Hu Y. Body composition trajectories during childhood predict skeletal maturation at puberty. Heliyon. 2024;10(16):e36381. Available from: https://doi.org/10.1016/j.heliyon.2024.e36381
- Silva HMB, Oliveira CC, Souza ALC, Aguiar LBV. Relationship between BMI and bone age. Nutr Hosp. 2019;36(5):1037–1042. Available from: https://doi.org/10.20960/nh.02068
- Chun D, Kim SJ, Suh J, Kim J. Pubertal changes in body composition. Pediatr Res. 2025;97(1):293–300.
- World Health Organization. The double burden of malnutrition: policy brief. Geneva: WHO; 2017. Available from: https://www.who.int/publications/i/item/WHO-NMH-NHD-17.3
- López-Laiseca JD, Massuça LM. Percentiles y curvas de crecimiento en Huila. Rev Fac Med. 2023;71:e102119.
- Ré AHN. Growth, maturation, and development: implications for sports practice. Motricidade. 2011;7(3):55–67. Available from: https://doi.org/10.6063/motricidade.103
- Jovanović J. The evaluation of biological maturity in sport. Sport Sci Pract. 2019;9(1):46–55. Available from: https://sportnaukaipraksa.vss.edu.rs/pdf/SNP-09-01_EN/5-Jovanovic.pdf
- Faigenbaum AD, Lloyd RS, Malina RM. Sequential training for young athletes. Br J Sports Med. 2015;49(17):1092–5.
- Vega SA, Martinez MG, Vera CE, Sacchi CE, Belzunce Lagos NV, et al. Maturational age and body composition in adolescent athletes. Int J Kinanthropometry. 2024;4(3):84–91. Available from: https://ijok.org/index.php/ijok/article/view/146
- Flores Olivares LA, De León LG, Fragoso MI. Skeletal age prediction model. Sci Rep. 2020;10:15768. Available from: https://doi.org/10.1038/s41598-020-72835-5
- Boyer ME, Middleton KM, Duren DL, Leary EV. Estimating peak height velocity: comparison of methods. Ann Hum Biol. 2020;47(5):434–45. Available from: https://doi.org/10.1080/03014460.2020.1763458
- Cao Z, Hui LL, Wong MY. New approaches to obtaining PHV using SITAR. Comput Methods Programs Biomed. 2018;163:79–85. Available from: https://doi.org/10.1016/j.cmpb.2018.05.030