Figure 1
Maximal stability limits in adolescents with Tourette syndrome
Mariève Blanchet*, François Prince, Martin Lemay, Sylvain Chouinard and Julie Messier
Published: 30 January, 2021 | Volume 4 - Issue 1 | Pages: 013-022
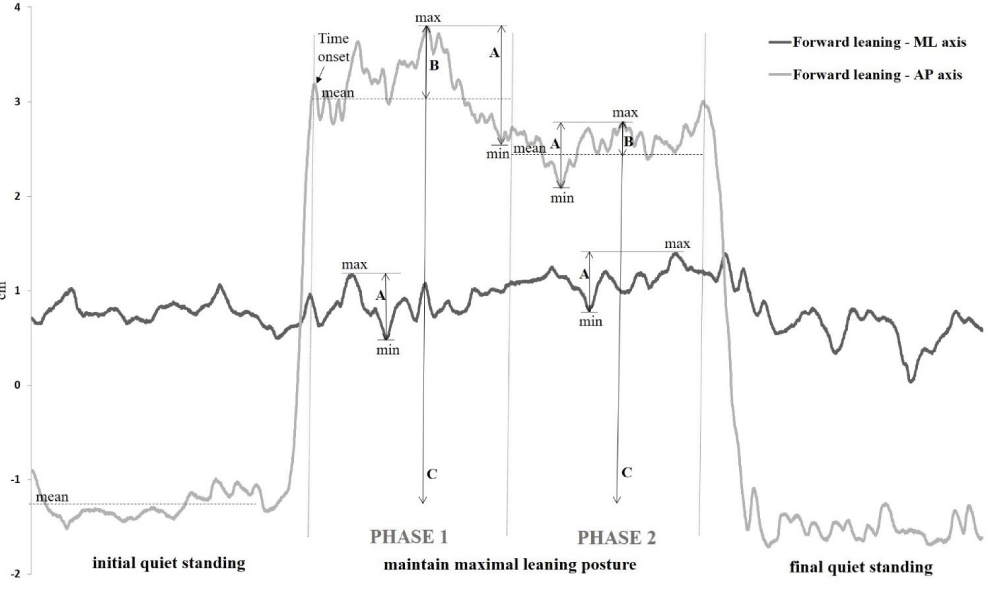
Figure 1:
Parameters considered in the data analysis during both phases are shown from a representative adolescent with GTS. The light gray line represents the AP COP excursion during a complete trial in the forward direction and the dark gray line represents the one in ML axis. The A represent min-max ranges, the B represent COPmax-COPmean and the C represent the maximum excursion of the COP.
Read Full Article HTML DOI: 10.29328/journal.japch.1001024 Cite this Article Read Full Article PDF
More Images
Similar Articles
-
Congenital poisoning after maternal parenteral mercury administrationBenjamin Courchia*,Leventer Roberts Maya,Meyer John,Galvez Maida,Herrera Jaime,Rauch Daniel. Congenital poisoning after maternal parenteral mercury administration. . 2018 doi: 10.29328/journal.japch.1001001; 1: 001-005
-
The Impact of Adenotonsillectomy on Health-Related Quality of Life in Paediatric PatientsShuaib Kayode Aremu*. The Impact of Adenotonsillectomy on Health-Related Quality of Life in Paediatric Patients. . 2018 doi: 10.29328/journal.japch.1001002; 1: 006-011
-
Severe Infantile Transaldolase deficiency: A case reportKhaled Alqoaer*,Ziad Asaad,Maisa Halabi. Severe Infantile Transaldolase deficiency: A case report. . 2019 doi: 10.29328/journal.japch.1001003; 2: 001-003
-
Prevalence of ESBL urinary tract infection in childrenKhalil Salameh*,Galia ZA Awean,Hala Elmohamed,Hoor Alshmayt,Mohamed Riad Bur Omer . Prevalence of ESBL urinary tract infection in children. . 2019 doi: 10.29328/journal.japch.1001004; 2: 004-007
-
Does it matter what a mother consumes? An anthropological exploration of dietary practices among Churachandpur (Manipur) pregnant women and its impact on infant birth weightJS Sehrawat*,Evelyn Ngaithianven,Reetinder Kaur. Does it matter what a mother consumes? An anthropological exploration of dietary practices among Churachandpur (Manipur) pregnant women and its impact on infant birth weight. . 2019 doi: 10.29328/journal.japch.1001005; 2: 008-014
-
Glycemic status and its effect in Neonatal Sepsis - A prospective study in a Tertiary Care Hospital in NepalBadri Kumar Gupta*,Binod Kumar Gupta,Amit Kumar Shrivastava,Pradeep Chetri. Glycemic status and its effect in Neonatal Sepsis - A prospective study in a Tertiary Care Hospital in Nepal. . 2019 doi: 10.29328/journal.japch.1001006; 2: 015-019
-
Branchio Oculo Facial SyndromeMaha Oudrhiri*,Toualouth L,Houda Oubejja,Fouad Ettayebi,Hicham Zerhouni. Branchio Oculo Facial Syndrome. . 2019 doi: 10.29328/journal.japch.1001007; 2: 020-020
-
Current childhood cancer survivor long-term follow-up practices in South AfricaAnel van Zyl*,Mariana Kruger,Paul C Rogers. Current childhood cancer survivor long-term follow-up practices in South Africa. . 2020 doi: 10.29328/journal.japch.1001008; 3: 001-007
-
Aripiprazole-induced seizures in children with autism spectrum disorder and epilepsyMohammed MS Jan*. Aripiprazole-induced seizures in children with autism spectrum disorder and epilepsy. . 2020 doi: 10.29328/journal.japch.1001009; 3: 008-010
-
Case-based education to improve learning and faculty teaching of residents and students in a clinical settingDiane E Lorant*,Elizabeth A Wetzel. Case-based education to improve learning and faculty teaching of residents and students in a clinical setting. . 2020 doi: 10.29328/journal.japch.1001010; 3: 011-015
Recently Viewed
-
Drug Rehabilitation Centre-based Survey on Drug Dependence in District Shimla Himachal PradeshKanishka Saini,Palak Sharma,Bhawna Sharma*,Atul Kumar Dubey,Muskan Bhatnoo,Prajkta Thakur,Vanshika Chandel,Ritika Sinha. Drug Rehabilitation Centre-based Survey on Drug Dependence in District Shimla Himachal Pradesh. J Addict Ther Res. 2025: doi: 10.29328/journal.jatr.1001032; 9: 001-006
-
Impact of Latex Sensitization on Asthma and Rhinitis Progression: A Study at Abidjan-Cocody University Hospital - Côte d’Ivoire (Progression of Asthma and Rhinitis related to Latex Sensitization)Dasse Sery Romuald*, KL Siransy, N Koffi, RO Yeboah, EK Nguessan, HA Adou, VP Goran-Kouacou, AU Assi, JY Seri, S Moussa, D Oura, CL Memel, H Koya, E Atoukoula. Impact of Latex Sensitization on Asthma and Rhinitis Progression: A Study at Abidjan-Cocody University Hospital - Côte d’Ivoire (Progression of Asthma and Rhinitis related to Latex Sensitization). Arch Asthma Allergy Immunol. 2024: doi: 10.29328/journal.aaai.1001035; 8: 007-012
-
Fiesta vs. Stress Condition the Incidence and the Age at Menarche. Forty Years of ResearchCarlos Y Valenzuela*. Fiesta vs. Stress Condition the Incidence and the Age at Menarche. Forty Years of Research. Clin J Obstet Gynecol. 2025: doi: 10.29328/journal.cjog.1001190; 8: 069-073
-
Transnasal Humidified Rapid-Insufflation Ventilatory Exchange (THRIVE) in High-Risk Endoscopic Procedures: A Non-Intubation ApproachNaba Madoo*,Vaibhavi Baxi. Transnasal Humidified Rapid-Insufflation Ventilatory Exchange (THRIVE) in High-Risk Endoscopic Procedures: A Non-Intubation Approach. Int J Clin Anesth Res. 2025: doi: 10.29328/journal.ijcar.1001033; 9: 035-036
-
Analysis and Control of a Suicide Dynamics ModelLakshmi N Sridhar*. Analysis and Control of a Suicide Dynamics Model. Arch Psychiatr Ment Health. 2025: doi: 10.29328/journal.apmh.1001059; 9: 022-028
Most Viewed
-
Feasibility study of magnetic sensing for detecting single-neuron action potentialsDenis Tonini,Kai Wu,Renata Saha,Jian-Ping Wang*. Feasibility study of magnetic sensing for detecting single-neuron action potentials. Ann Biomed Sci Eng. 2022 doi: 10.29328/journal.abse.1001018; 6: 019-029
-
Evaluation of In vitro and Ex vivo Models for Studying the Effectiveness of Vaginal Drug Systems in Controlling Microbe Infections: A Systematic ReviewMohammad Hossein Karami*, Majid Abdouss*, Mandana Karami. Evaluation of In vitro and Ex vivo Models for Studying the Effectiveness of Vaginal Drug Systems in Controlling Microbe Infections: A Systematic Review. Clin J Obstet Gynecol. 2023 doi: 10.29328/journal.cjog.1001151; 6: 201-215
-
Causal Link between Human Blood Metabolites and Asthma: An Investigation Using Mendelian RandomizationYong-Qing Zhu, Xiao-Yan Meng, Jing-Hua Yang*. Causal Link between Human Blood Metabolites and Asthma: An Investigation Using Mendelian Randomization. Arch Asthma Allergy Immunol. 2023 doi: 10.29328/journal.aaai.1001032; 7: 012-022
-
An algorithm to safely manage oral food challenge in an office-based setting for children with multiple food allergiesNathalie Cottel,Aïcha Dieme,Véronique Orcel,Yannick Chantran,Mélisande Bourgoin-Heck,Jocelyne Just. An algorithm to safely manage oral food challenge in an office-based setting for children with multiple food allergies. Arch Asthma Allergy Immunol. 2021 doi: 10.29328/journal.aaai.1001027; 5: 030-037
-
Impact of Latex Sensitization on Asthma and Rhinitis Progression: A Study at Abidjan-Cocody University Hospital - Côte d’Ivoire (Progression of Asthma and Rhinitis related to Latex Sensitization)Dasse Sery Romuald*, KL Siransy, N Koffi, RO Yeboah, EK Nguessan, HA Adou, VP Goran-Kouacou, AU Assi, JY Seri, S Moussa, D Oura, CL Memel, H Koya, E Atoukoula. Impact of Latex Sensitization on Asthma and Rhinitis Progression: A Study at Abidjan-Cocody University Hospital - Côte d’Ivoire (Progression of Asthma and Rhinitis related to Latex Sensitization). Arch Asthma Allergy Immunol. 2024 doi: 10.29328/journal.aaai.1001035; 8: 007-012

If you are already a member of our network and need to keep track of any developments regarding a question you have already submitted, click "take me to my Query."


